
Indian Stock Market Volatility in September 2026: Reading False Breakouts and Using Vyapar Sanket

Table Of Content
- Indian Stock Market Volatility in September 2026: Reading False Breakouts and Using Vyapar Sanket
- What changed in the latest session?
- Where the chart can mislead you
- NIFTY 50: a recovery candle is not automatically a trend change
- HDFC Bank: a strong daily candle can still sit inside a damaged structure
- Reliance Industries: a sharp surge can end with rejection rather than continuation
- TCS: a bounce without confirmation can become a lower-high setup
- A chart-reading checklist for possible liquidity traps
- How to use Vyapar Sanket when volatility rises
- What should investors and traders do now?
- Watch the related video
- Sources and methodology
Author and methodology
Layr0
Quantitative research and trading technology team
Layr0 publishes research on market structure, quantitative workflows, broker connectivity, and risk-managed algorithmic execution for Indian and global markets.
Methodology: Research is reviewed for query intent, practical usefulness, and financial risk clarity before publication. Market articles separate observations from predictions and should not be read as investment advice.
This article is educational and operational research. It is not investment advice, and past or backtested performance does not guarantee future results.
For risk-managed execution
Add risk checks before live orders
Define loss limits, position sizing, exposure caps, approvals, and kill-switch behavior before deploying trading workflows.
Review Risk ControlsIndian Stock Market Volatility in September 2026: Reading False Breakouts and Using Vyapar Sanket
Published 12 September 2026. Market data in this article refers to the latest completed Indian trading session, 11 September 2026, unless stated otherwise.
The September market has been difficult because the headline index has not told the whole story. On 11 September, the Nifty 50 closed at 23,398.10, up 0.34% on the day after recovering from an early decline, while the Sensex closed at 74,781.76, up 0.16%. Both benchmarks still recorded a fifth consecutive weekly fall. Reuters reported that the two indices lost more than 2% during the week and about 4.8% over the previous five weeks, as oil, geopolitical risk, global yields, and foreign selling weighed on sentiment.
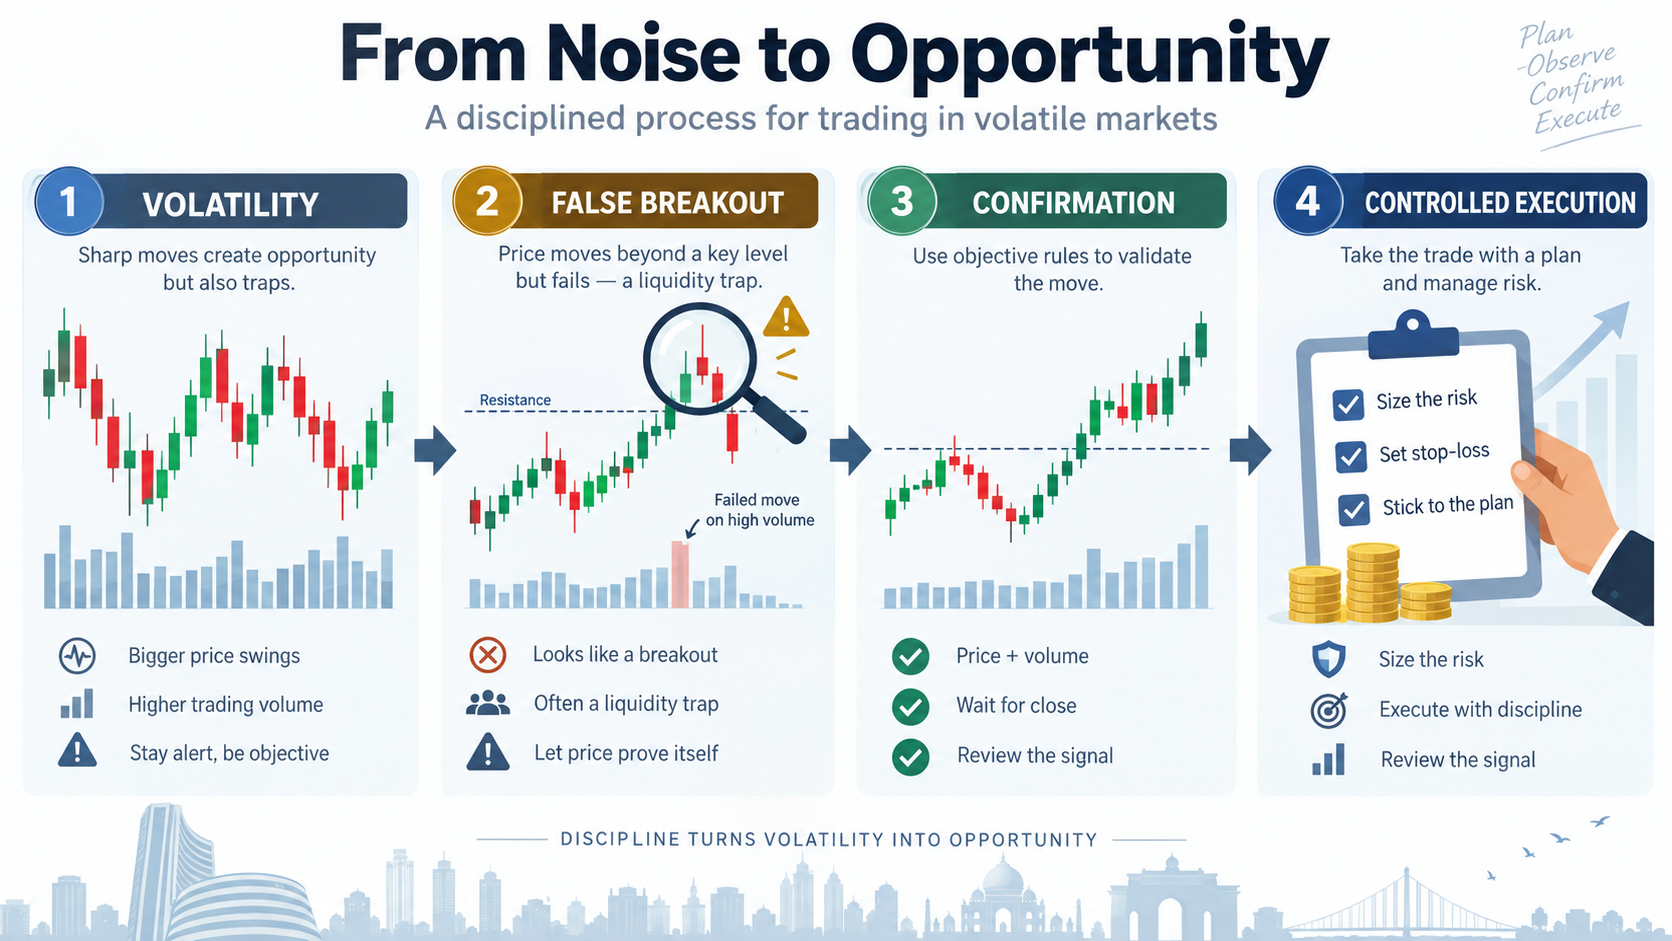
The practical question is not whether every sharp move is “fake.” A chart cannot prove manipulation. The better question is whether a move has enough confirmation to justify taking risk. A price that briefly breaks a level, fails to hold it, and reverses into a wide range can be a possible false breakout or liquidity trap. That is a warning to slow down, not a conclusion about illegal activity.
What changed in the latest session?
The 11 September session showed a useful contrast: a weak opening, a recovery from the day’s low, and a close that still sat inside a fragile weekly structure. Moneycontrol reported that the Nifty finished near 23,400 after recovering roughly 600 points from the Sensex’s low. The same report noted broad participation on the downside, with 1,727 shares advancing, 2,293 declining, and 171 unchanged.
| Indicator | Latest observation | How to read it |
|---|---|---|
| Nifty 50 close | 23,398.10, +0.34% on 11 Sep | A positive close did not erase the weekly downtrend. |
| Sensex close | 74,781.76, +0.16% on 11 Sep | Intraday recovery, but still a weak five-week backdrop. |
| Brent crude | $104.88 on 11 Sep in Moneycontrol’s report | High energy costs can reinforce inflation and rate concerns. |
| FII cash flow, 10 Sep | -₹438.24 crore | Foreign selling remained a short-term pressure signal. |
| DII cash flow, 10 Sep | +₹1,025.85 crore | Domestic buying cushioned, but did not remove, volatility. |
| India VIX, 10 Sep | 11.73 | A moderate reading can still coexist with sharp stock-specific moves. |
The FII/DII numbers are cash-market observations and should not be treated as a standalone forecast. Upstox’s published table shows three consecutive days of FII cash selling through 10 September while DIIs remained net buyers. The important signal is the divergence: one pool of capital is reducing exposure while another is absorbing supply.
Where the chart can mislead you
The following TradingView captures were downloaded on 12 September 2026. They show daily NSE charts and retain TradingView attribution. The amber callouts identify regions worth investigating as possible failed breakouts, reclaims, or reversals. They are observations, not claims of market manipulation.
NIFTY 50: a recovery candle is not automatically a trend change
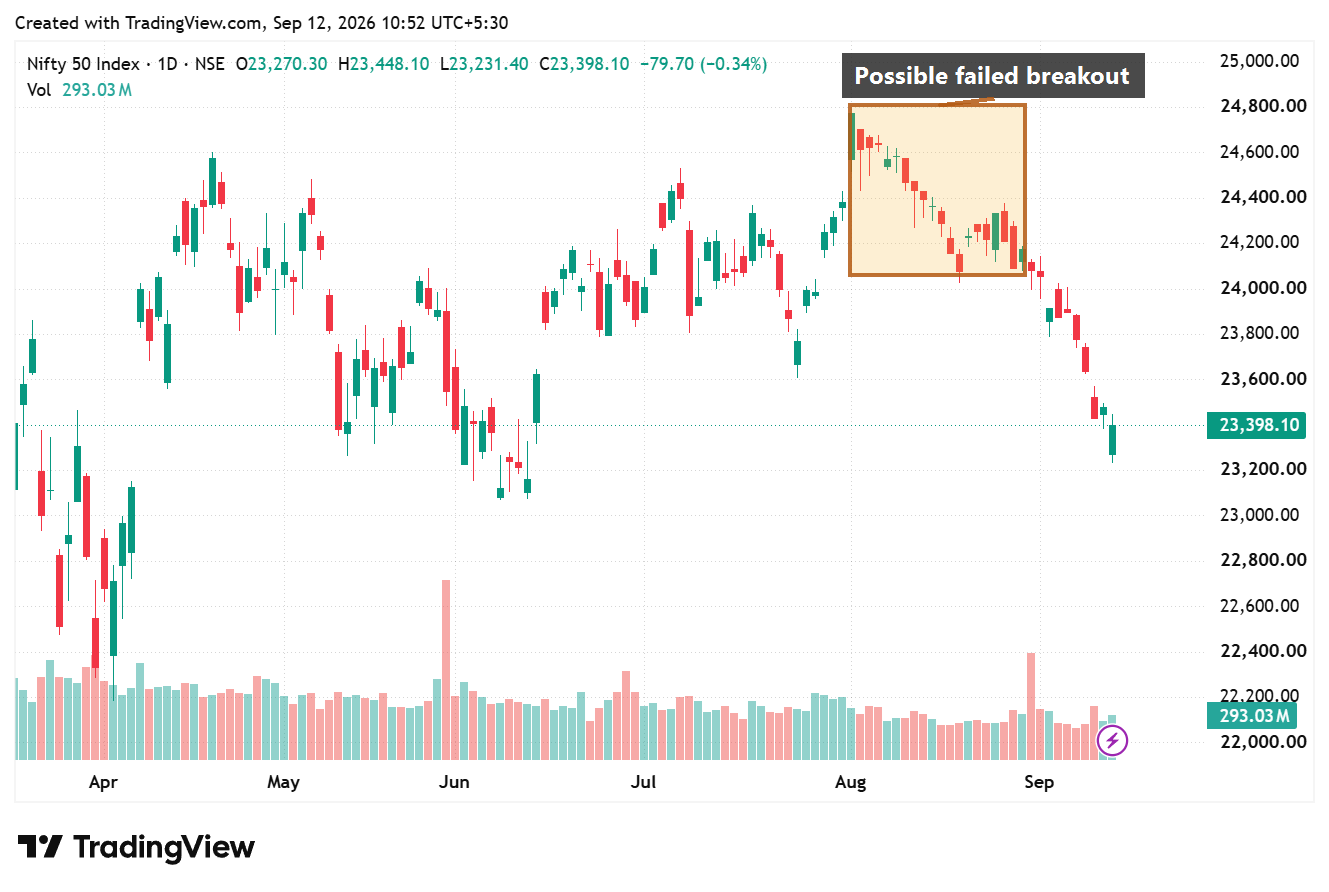
The late-August push toward the upper part of the visible range was followed by a sustained decline into September. A trader who treats one green candle or one intraday recovery as confirmation may enter just before the broader structure resumes lower. Confirmation would require a close above the relevant swing area followed by acceptance, not just a wick through it.
HDFC Bank: a strong daily candle can still sit inside a damaged structure
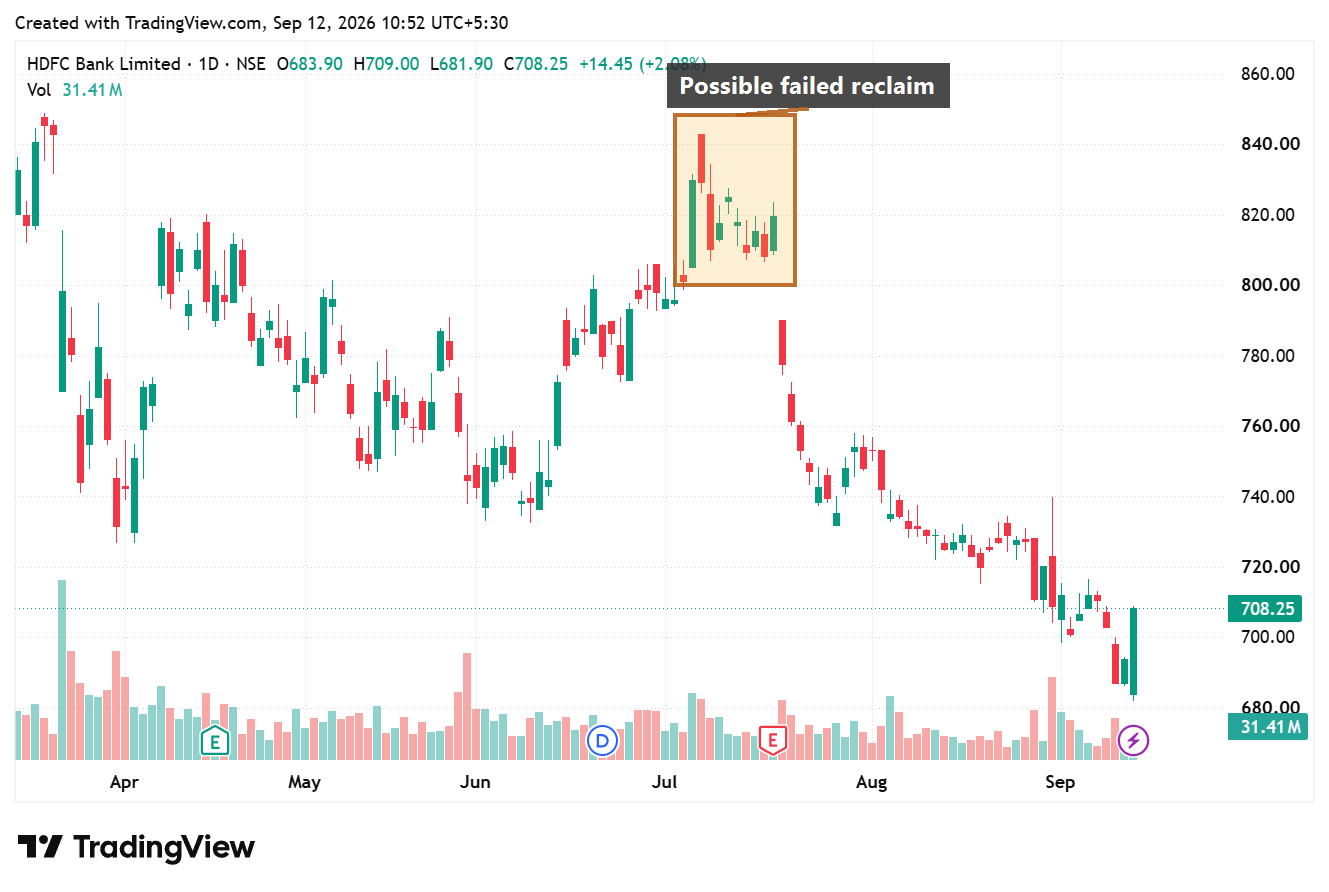
HDFC Bank’s 11 September close was ₹708.25, up 2.08% for the session, with volume of about 31.41 million shares versus a 30-day average of 27.84 million on the TradingView snapshot. The green close deserves attention, but the visible multi-month decline means the first task is to test whether resistance is reclaimed and held. A single strong candle is evidence of demand for one session; it is not proof that the larger trend has reversed.
Reliance Industries: a sharp surge can end with rejection rather than continuation
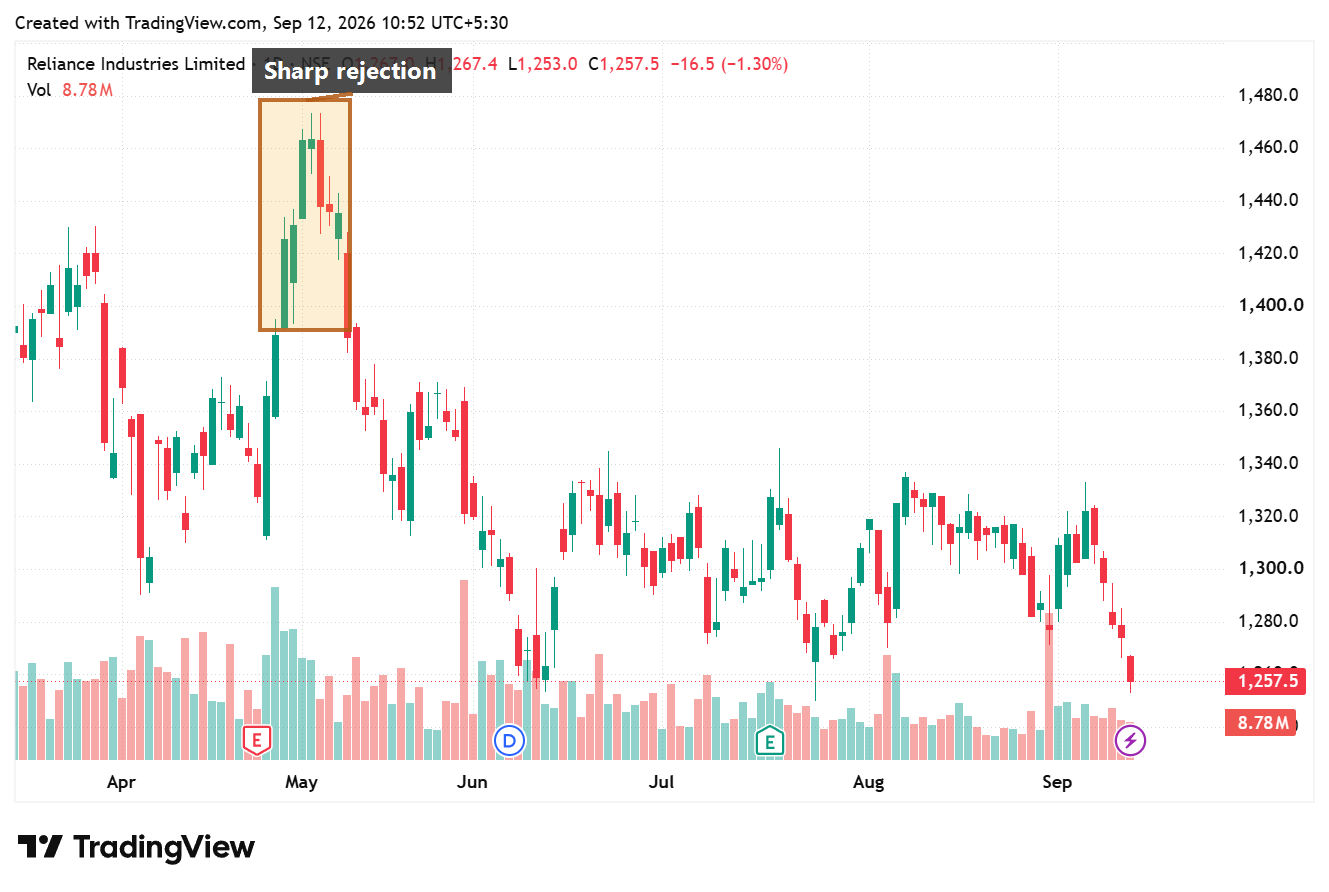
Reliance closed at ₹1,257.50 on 11 September, down 1.30%, with the TradingView snapshot showing volume below its 30-day average. The earlier surge and subsequent rejection illustrate why a breakout needs follow-through. If price expands quickly but the next candles cannot hold the breakout zone, chasing the first move creates an unfavourable entry even when the long-term business story remains intact.
TCS: a bounce without confirmation can become a lower-high setup
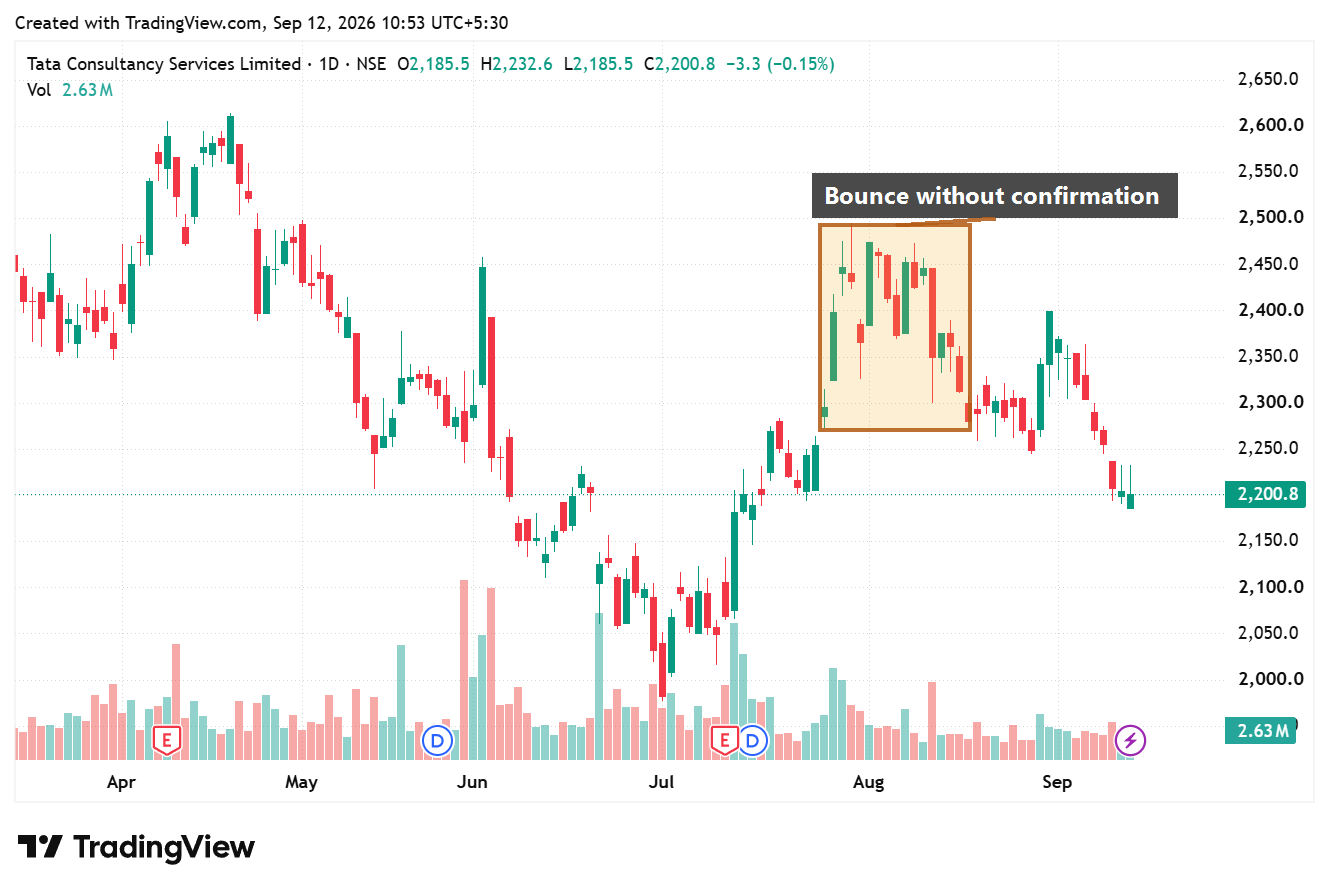
TCS closed at ₹2,200.80 on 11 September. The visible chart shows a rebound from the June low followed by a failure to sustain the later recovery area. This is a reminder to compare price with volume and structure. A bounce becomes more useful when it creates a higher high, holds a reclaimed level, and attracts participation rather than simply producing a temporary green candle.
A chart-reading checklist for possible liquidity traps
| Observed behaviour | Missing confirmation | Risk of entering | Wait for | Vyapar Sanket workflow |
|---|---|---|---|---|
| Price pierces resistance and closes back below it | No close-and-hold above resistance | Buying into rejection | A later close above the level with follow-through | Review the signal context before acting; avoid treating the first alert as permission to enter. |
| Long wick with a wide intraday range | No sustained acceptance near the extreme | Stop distance and slippage can expand | A tighter range or confirmed continuation | Check position size, broker readiness, and risk limits before an OPEN action. |
| Price rises while volume is ordinary or falling | Participation does not confirm the move | A thin move can reverse quickly | Price and volume alignment | Use the app’s signal and market context to decide whether to wait, observe, or act. |
| Recovery occurs inside a larger downtrend | No higher high or higher low | A bounce may become a lower high | Structure change across more than one candle | Prefer a controlled, rules-based workflow over an impulsive reaction. |
| FII selling is absorbed by DII buying | Flow divergence remains unresolved | Index support may hide stock-level weakness | Broader breadth and follow-through | Keep the signal review separate from a single institutional-flow headline. |
How to use Vyapar Sanket when volatility rises
Vyapar Sanket is most useful here as a process layer. It does not make a volatile market predictable, and a published signal is not a guarantee of a fill or outcome. A disciplined workflow is:
- Review the signal. Check the instrument, direction, timeframe, entry context, and whether the chart has confirmed the move. A possible false breakout is a reason to pause and reassess.
- Confirm the goal and broker setup. Use the configured broker account and selected trading or investing goal. Do not place an order until the account, symbol, quantity, and intended action are clear.
- Size the risk before OPEN. Decide the amount that can be risked, the invalidation level, and the maximum daily exposure. A volatile candle should generally reduce size or delay entry, not encourage larger leverage.
- Treat OPEN and CLOSE differently. An OPEN signal starts a position only after the user’s checks pass. A CLOSE signal is an exit instruction and should remain actionable even when the user is pausing new entries.
- Monitor the broker result. A signal being received is not the same as an order being accepted or filled. Review the broker response and position state after execution.
- Record the decision. Note why the signal was accepted, delayed, or rejected. This creates a repeatable review loop instead of a story built from hindsight.
For investors, the same discipline can mean not acting on an intraday move at all. SEBI’s investor guidance identifies market, liquidity, volatility, and currency risks and recommends matching investments to the time horizon and risk appetite. Diversification can reduce concentration risk, but it cannot remove market-wide volatility.
What should investors and traders do now?
For the next session, the useful framework is conditional rather than predictive:
- Treat 23,200–23,000 as an area reported by Moneycontrol’s cited analysts as a possible downside reference, not as a guaranteed support zone.
- Treat 23,520 and the 23,650 gap area as observation levels from the same report, not automatic buy or sell triggers.
- Watch whether crude remains above $100, whether breadth improves, and whether a recovery is accepted beyond the first intraday bounce.
- Reduce impulsive entries when price, volume, and institutional flows disagree.
- Use Vyapar Sanket to review, size, gate, execute, and reconcile decisions—not to replace judgment or risk management.
The central lesson is simple: volatility creates movement, but movement alone is not confirmation. The better response is a documented process that can wait for evidence, limit exposure, and distinguish a received signal from a completed trade.
Watch the related video
Sources and methodology
- Reuters report hosted by MarketScreener: India stocks log fifth weekly loss as oil fears grip markets — 11 September 2026 close and weekly context.
- Moneycontrol: Sensex ends 600 points higher from day’s low — session breadth, levels, crude, and recovery context.
- Upstox FII/DII data — institutional cash-flow observations through 10 September 2026.
- TradingView NIFTY 50, HDFC Bank, Reliance Industries, and TCS — chart captures downloaded 12 September 2026.
- SEBI Investor: Key risks in investing — educational risk framing.
For information, not investment advice.
Related research
Keep exploring this topic
AI Stocks
AI Stock Bubble in 2026: Global Mania, Indian Spillovers, and What Investors Should Watch
A balanced look at the 2026 AI stock bubble debate, covering global valuation risks, Indian market spillovers, data-center narratives, and practical investor checks.
AI Trading
AI Trading Performance in India: 2026 Model Review
Review how Layr0 evaluates AI trading models in Indian markets, including backtesting methods, risk controls, and performance assumptions.
Algo Trading
Cross-Broker Algo Trading Platforms in India
Compare Indian algo trading platforms for broker support, no-code workflows, automation limits, and execution controls.
Next workflow review
Move from reading to execution planning
Add risk checks before live orders
Define loss limits, position sizing, exposure caps, approvals, and kill-switch behavior before deploying trading workflows.