
India–China Trade in 2026: The Numbers, the Diplomatic Reset, and Supply-Chain Risk
Table Of Content
- India–China trade in 2026: read the relationship through the evidence
- The trade gap is real, but it is not the whole story
- What the trade relationship means for a company
- BRICS, G20, and the practical signs of engagement
- The river projects: separate construction from feasibility work
- A company-level review checklist
- Limits and risk
- Sources and methodology
Author and methodology
Layr0
Quantitative research and trading technology team
Layr0 publishes research on market structure, quantitative workflows, broker connectivity, and risk-managed algorithmic execution for Indian and global markets.
Methodology: Research is reviewed for query intent, practical usefulness, and financial risk clarity before publication. Market articles separate observations from predictions and should not be read as investment advice.
This article is educational and operational research. It is not investment advice, and past or backtested performance does not guarantee future results.
Reader question
How should Indian investors interpret current India-China trade, diplomatic engagement, and supply-chain exposure?
Last reviewed: 30 October 2026
India–China trade in 2026: read the relationship through the evidence
Trade between India and China has kept growing, even while their governments continue to manage serious differences. That combination can sound contradictory. It is easier to understand when we separate the trade data, diplomatic statements, infrastructure decisions, and the actual operating exposure of a company.
This article carries a 20 September 2026 publication date and was substantially refreshed on 30 October 2026. The refresh adds developments and data published after 20 September, including India’s September meeting with China’s president at the BRICS Summit and DGCIS trade observations through August 2026. The two dates are shown separately so readers can see when the new evidence entered the article.
The trade gap is real, but it is not the whole story
The Department of Commerce’s Trade Intelligence and Analytics portal publishes country-level goods trade data sourced from DGCIS. Its calendar-year series reports India’s 2025 exports to China at about US$18.06 billion and imports at about US$124.82 billion. The balance is negative by about US$106.76 billion—equivalent to a deficit of roughly US$106.76 billion when expressed as imports less exports. These are calendar-year figures, not India’s April–March fiscal-year totals.
The portal’s latest monthly observations available at this research cutoff run through August 2026. January–August imports from China were materially higher than exports in every month in the series. For example, reported imports were about US$14.67 billion in July and US$12.78 billion in August, while exports were about US$2.19 billion and US$1.83 billion respectively. A monthly series can be lumpy, so compare like periods and avoid treating a single month as a trend by itself.
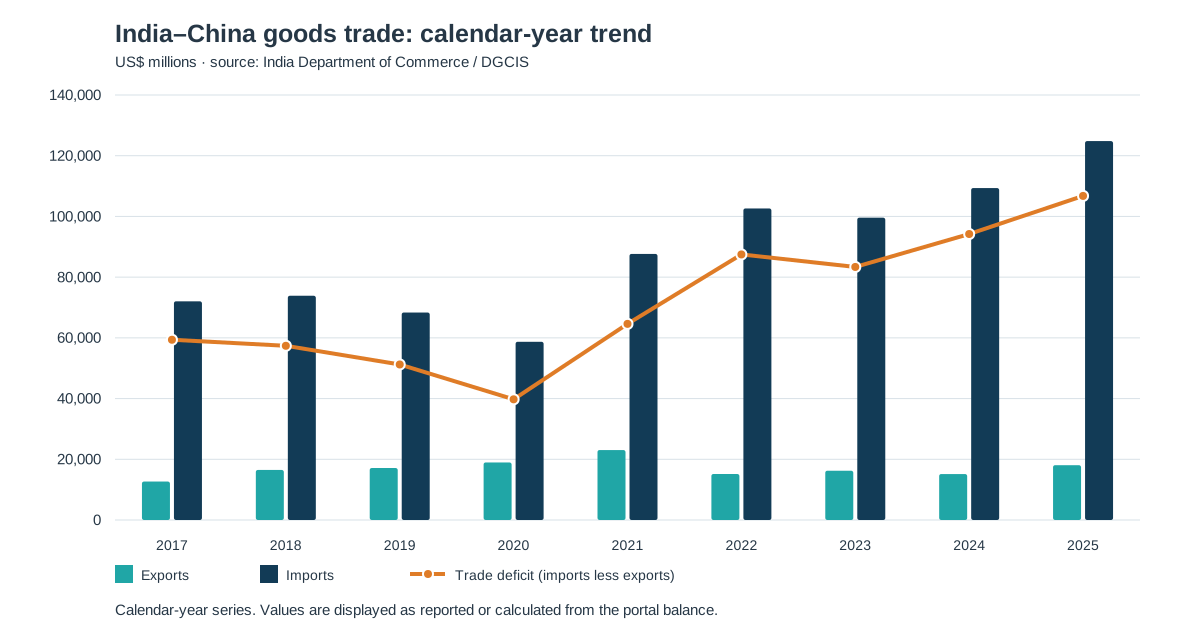
Annual calendar-year goods trade observations. Bars show exports and imports; the line shows the deficit, calculated as imports less exports. Do not compare this series directly with fiscal-year totals.
Source: DGCIS via India Department of Commerce TIA country dashboard; captured 30 October 2026 · 2017–2025 · US$ millions
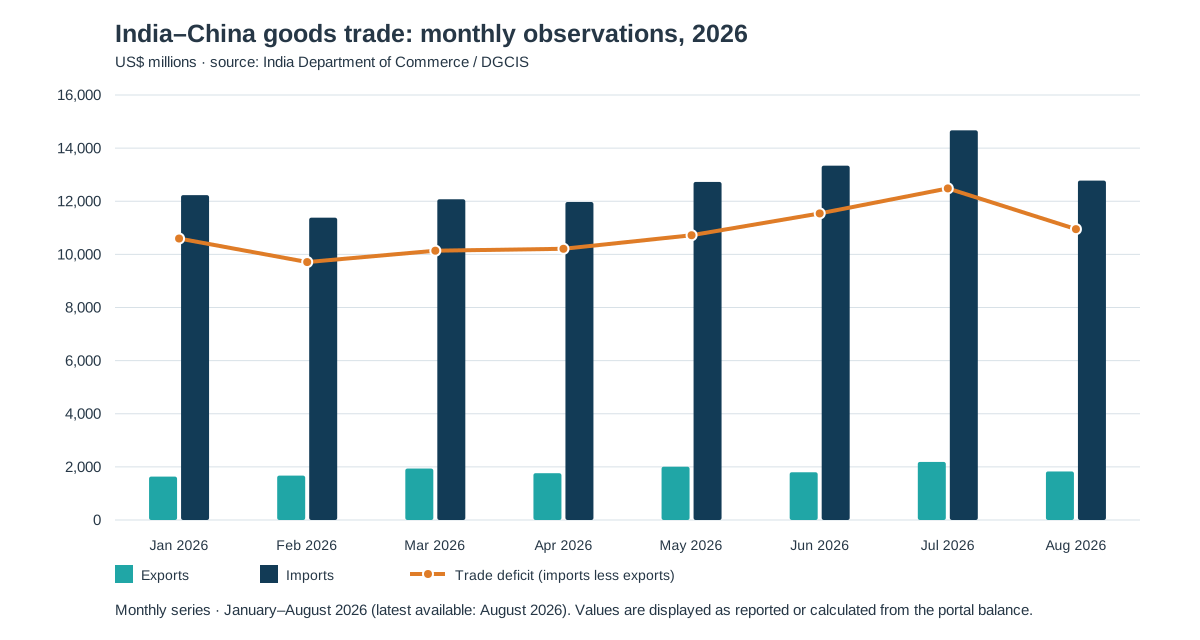
Monthly calendar-year observations through the latest month available in the TIA portal at capture. The line is the reported negative trade balance converted to a positive deficit for display.
Source: DGCIS via India Department of Commerce TIA country dashboard; captured 30 October 2026 · January–August 2026 · US$ millions
The Embassy of India in Beijing’s trade table reports a different, fiscal-year view: for FY 2025–26 it lists exports of US$19.47 billion, imports of US$131.63 billion, and a deficit of US$112.16 billion. Its partial April–May 2026 row is also labelled separately. Those fiscal-year values should not be spliced into the calendar-year charts above. Differences between series may also reflect the period definition, revisions, or data vintage; use one consistent source and period when calculating a change.
India’s parliamentary response on trade with China says the earlier April–October 2025 deficit rose to US$63.97 billion from US$58.09 billion in the comparable 2024 period. It also describes imports such as electronic parts, mobile-phone parts, machinery, auto components, and active pharmaceutical ingredients as inputs used in Indian production, including goods later exported. That is an important qualification: a deficit can coexist with Indian manufacturers relying on imported components to make finished products. Read the government response for its period and context.
What the trade relationship means for a company
A national trade balance cannot tell you whether a particular company is exposed, resilient, or likely to benefit. For that, move from country totals to the company’s inputs and customers. Start with the relevant product category, then check the issuer’s own disclosures for supplier concentration, imported components, inventory, pricing terms, currency exposure, and how long a substitute supplier would take to qualify.
The risk runs in both directions. A manufacturer dependent on a specialised Chinese input may be vulnerable to delays or access restrictions. A domestic supplier may see an opportunity, but only if it has capacity, customer approval, competitive cost, and enough working capital. A localisation announcement does not prove that the entire bill of materials is local; imported equipment or intermediate goods may remain essential.
The Prime Minister’s Office said that when Narendra Modi and Xi Jinping met on 12 September 2026 on the sidelines of the BRICS Summit in New Delhi, they discussed structural trade imbalance, supply-chain issues, predictable market access, business links, and people-to-people exchanges. The statement records areas of discussion. It does not announce that the trade imbalance has been resolved or that either country has changed its market-access rules. Read the meeting statement.
BRICS, G20, and the practical signs of engagement
It is useful to keep the summit names and outcomes straight. Modi and Xi met at the BRICS Summit on 12 September. Separately, the G20 Trade Ministers’ Meeting took place in Milwaukee on 30 September and 1 October. India’s Commerce Ministry reported that ministers reached consensus on a statement about the weaponization of food through coercive trade actions. That multilateral outcome is not a bilateral India–China trade agreement. The G20 Leaders’ Summit in Miami was still scheduled for 14–15 December 2026 at the time of this article’s October refresh; it had not yet taken place. The Indian government’s meeting update records India’s participation and that outcome; USTR’s calendar provides the US host’s agenda and leaders’ summit dates. The G20 Chair’s Statement records the meeting’s broader work.
There are also practical signs of people-to-people contact. The Indian Embassy in Beijing’s political-relations page records direct flight services resuming in October 2025 and the Kailash Mansarovar Yatra resuming in 2025 and continuing in 2026. It also documents official channels for border, river, and bilateral dialogue. These developments make communication and travel more possible; they do not by themselves remove trade barriers, settle the border question, or guarantee that business links will expand.
The river projects: separate construction from feasibility work
China’s government announced that construction of the hydropower project on the lower reaches of the Yarlung Zangbo River began on 19 July 2025. A further Chinese government update in April 2026 described officials visiting the construction site. These sources support saying that construction began and remains an active project; they do not support claims about a specific downstream flow outcome or a completed timetable. Project start · April 2026 construction update.
India’s proposed Siang Upper Multipurpose Project is at a different stage. Arunachal Pradesh’s September 2026 government updates describe an ongoing Pre-Feasibility Report exercise to assess whether and how the project could be developed; officials say the PFR is not a final construction decision. Concerns about water security, local communities, environmental impacts, and downstream conditions should be reported as issues requiring technical assessment and public consultation—not as proven effects of either project. Arunachal Pradesh government update, 27 September · Chief Minister’s PFR clarification, 30 September.
A company-level review checklist
For a listed company or sector, keep the analysis tied to evidence that can be checked:
- Name the exposure. Identify the HS category or component and the issuer’s filing, presentation, or other primary disclosure that links it to the business.
- Measure the dependency. Look for supplier concentration, inventory cover, currency terms, and the time and cost required to qualify an alternative.
- Trace the earnings path. Ask whether higher input costs can be passed through, whether the company has spare capacity, and whether a possible local substitute is already approved by customers.
- Separate news from operating change. A summit statement, project announcement, or policy proposal is not the same as a signed rule, a commissioned facility, or a change in a supplier contract.
- Write down what would change your mind. A new issuer filing, a change in import data, documented supplier diversification, a market-access decision, or an enacted restriction may strengthen or weaken the thesis.
Layr0 / workflow map
From bilateral data to a company-level research question
- 01Choose a trade category
- 02Check the DGCIS period
- 03Match issuer disclosures
- 04Stress-test cost and supply
- 05Record what would disprove the view
Original Layr0 process infographic. Illustrative workflow; not a product screenshot or a promise of broker availability, execution quality, or investment outcome.
Limits and risk
This is market and trade context, not investment advice or a recommendation to buy, sell, or trade any company. Trade figures may be revised, classifications can change, and issuer disclosures may not expose every supplier relationship. Diplomatic statements do not guarantee implementation. Infrastructure projects can change scope or schedule and may have impacts that require further engineering, environmental, and community review. Verify the latest official documents and the company’s filings before relying on a conclusion.
For the related trade-policy comparison, read India–US trade policy. For the transmission from international events into Indian assets, see global events and Indian markets. Continue with Layr0’s quant research workflow.
Sources and methodology
The refreshed research cutoff is 30 October 2026. DGCIS annual observations are calendar years 2017–2025; monthly observations are January–August 2026, the latest period shown by the portal at capture. The portal reports trade values in US$ millions. For the charts, the deficit is calculated as imports less exports from the reported balance (exports minus imports); no missing months or annual observations are estimated. The captured values are retained in the source-data CSV. Fiscal-year figures from the Embassy page are discussed separately and are not mixed into the calendar-year charts. Company-exposure analysis is Layr0’s interpretation; factual claims are linked to government, issuer, or official exchange sources beside the relevant text.
- Department of Commerce TIA country dashboard
- DGCIS annual-series data endpoint
- DGCIS monthly-series data endpoint
- Embassy of India, Beijing: trade and economic relations
- Government of India parliamentary response on India–China trade
- Prime Minister’s Office: 12 September 2026 Modi–Xi meeting
- PIB: G20 Trade Ministers’ Meeting notice
- PIB: India’s participation and G20 Trade Ministers’ Meeting outcome
- USTR: 2026 G20 ministerial and leaders’ summit dates
- G20 Trade Ministers’ Chair’s Statement
- Indian Embassy in Beijing: political relations and exchanges
- China government: Yarlung Zangbo project construction announcement
- China government: April 2026 construction-site update
- Arunachal Pradesh government: SUMP PFR process
Related research
Keep exploring this topic
AI Stocks
AI Stock Bubble Debate: A Test for Indian Investors
Use valuation, revenue quality, capital spending, and portfolio exposure to assess AI-market spillover risk without predicting a bubble.
AI Trading
AI Trading Performance in India: How to Test a Model
A decision framework for Indian trading teams evaluating AI-assisted strategies: data leakage, costs, risk, broker status, and live monitoring.
Algo Trading
Cross-Broker Algo Trading in India: A Practical Evaluation Guide
Compare Indian broker-connected trading workflows by authorization, order state, risk controls, and reconciliation rather than headline broker counts.
Next workflow review